

Wheat: do grain costs ease or bite back?
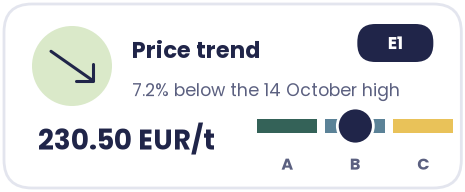
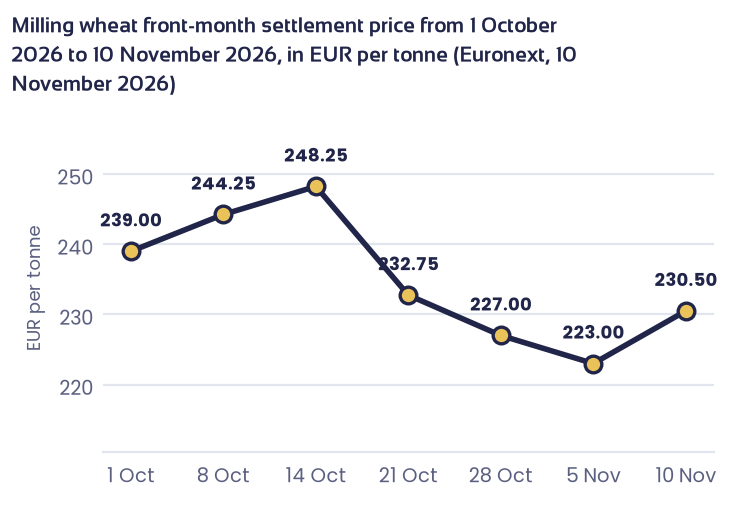
Euronext milling wheat settled at EUR 230.50 per tonne on 10 November 2026, 7.2% below its 14 October 2026 high but 21.8% above a year ago. The market is asking: do ample world stocks and easing Black Sea tension keep pushing prices down, or does a smaller EU crop with thin EU stocks lift them again?
The short answer
Most likely, scenario A: prices fall, but only narrowly. 3 of the 7 signals that show a clear direction point that way, 2 point to scenario B (prices hold) and 2 to scenario C (prices rise). Barchart, a market commentator, also sees lower prices in Chicago.
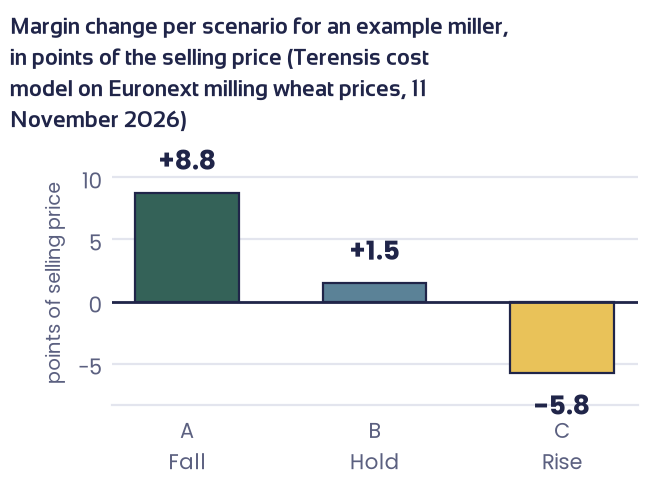
For an example miller, falling prices leave EUR 8.77 more of every EUR 100 of sales as margin, compared with the wheat cost already in the selling price. A rise would cost EUR 5.75.
What to do: buy in monthly steps and keep part of your volume open.
The three scenarios
Signals = the share of the 7 signals with a clear direction that point to the scenario (5 more have no clear reading); this is not a statistical chance. Wheat price = what you pay for wheat not yet bought over the next 3 months (Euronext, 10 November 2026, in euros). Margin change = percentage points of the selling price, an example miller, selling price unchanged (part 3).
Read the full Margin Call
Leave your email address to read the scenarios in detail, the evidence behind every signal and the cost model, and to download the PDF.
We use your email address to give you access and to follow up on this Margin Call. You can object at any time. More in our privacy policy.
1. Which scenario is most realistic? Scenario A: prices fall


Source: publishers and dates in part 5; readings dated 2 November 2026 to 11 November 2026. Click a card to jump to its evidence.
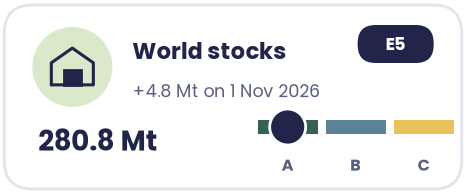
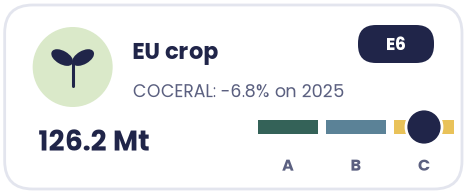
Why A leads: the USDA raised world stocks again on 1 November 2026, the futures curve slopes down, funds are cutting their bets on rising prices and Russian export prices fell, as reported on 10 November 2026. Why it is not certain: the lead is narrow, 3 of 7. The EU crop is about 7% smaller, EU stocks are lower than in about 9 of 10 years since 1999, and the Abu Dhabi talks on 10 and 11 November 2026 have no result yet.
| Other market participants | Their view | Against our most likely scenario |
|---|---|---|
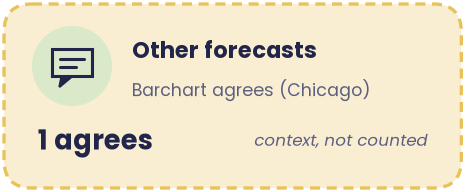
| Barchart | Sees a selling opportunity in March 2027 Chicago soft red winter wheat futures "on more price weakness" (6 November 2026). This is the Chicago market, not Euronext milling wheat. | Scenario A: agrees |
Source: Barchart, 6 November 2026. Outside views are context; they are not counted in the signals.
2. How do the other scenarios answer the question?
| Scenario | What this scenario says | What we would see first | Signals |
|---|---|---|---|
| Scenario B: prices hold | The fall stops here. It is not lasting, and it is not the start of a rise. | The Abu Dhabi talks end without a result and Russian export prices stop falling; funds stop cutting their bets. | 2 of 7 |
| Scenario C: prices rise | The fall was temporary. A smaller EU crop and thin EU stocks lift prices again. | The USDA's next world and EU stock estimates (projected 10 December 2026) come in lower; the first French winter wheat condition ratings are weak. | 2 of 7 |
Source: signals in part 1, readings dated 2 November 2026 to 11 November 2026. 'What we would see first' is our reading.
3. What do the scenarios mean for my margin?
Base and how to read the numbers
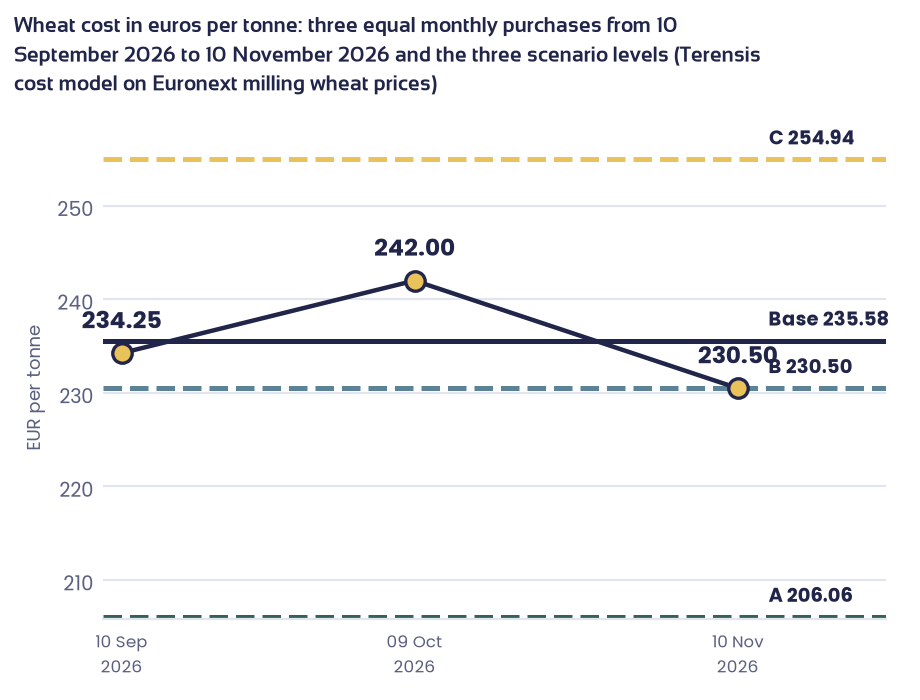
Base: the wheat cost that is already in the selling price today: EUR 235.58 per tonne of wheat, the average of three equal monthly purchases on 10 September 2026, 9 October 2026 and 10 November 2026.
How to read the numbers: "-2.0" means that of every EUR 100 of sales, EUR 2 less stays as margin. "+1.0" means EUR 1 more stays. The selling price is assumed unchanged. An example miller: wheat is 70% of the selling price, all other costs and margin 30%.
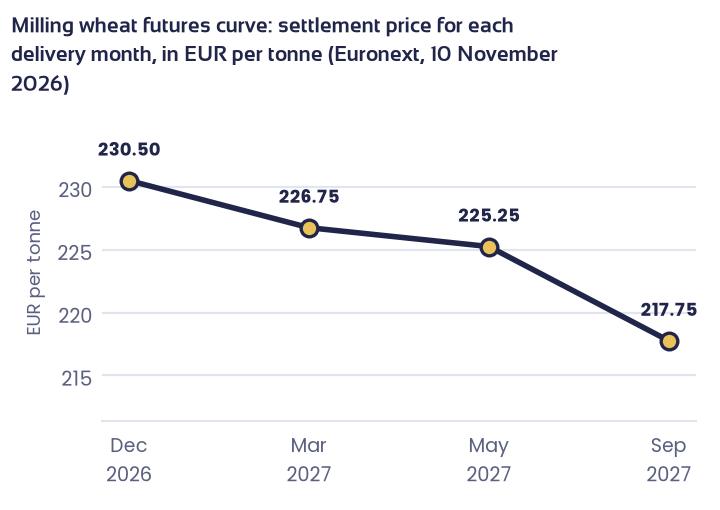
Even if prices hold (scenario B), margin rises by 1.5 points, because the base includes purchases at EUR 234.25 on 10 September 2026 and EUR 242.00 on 9 October 2026, both above today's EUR 230.50. If the new purchases are priced on today's futures curve (December 2026 EUR 230.50, March 2027 EUR 226.75 per tonne), margin rises by 2.3 points.
4. What should I do now?
Not in one step. Falling prices are most likely, not certain. Three moves work in both cases:
What would change the call: milling wheat settlement price
Three open questions
- Black Sea. Do the Abu Dhabi talks of 10 and 11 November 2026 ease supply risk? Answer: the outcome of the talks and Russian export prices on 18 November 2026.
- EU crop. How well is the 2027 winter wheat crop starting? Answer: the first FranceAgriMer condition ratings.
- Stocks. Does the USDA raise world stocks again? Answer: the USDA report on 10 December 2026 (projected date).
5. Evidence
| Signal | Reading | Publisher and date | Points to |
|---|---|---|---|
| E1 Price trend ↑ | EUR 230.50 per tonne (settled 10 November 2026), 7.2% below the 14 October 2026 high of EUR 248.25 and 21.8% above a year ago; between its 10-day average (EUR 226.5) and its 20-day average (EUR 232.2). | Euronext, 10 November 2026 | Scenario B |
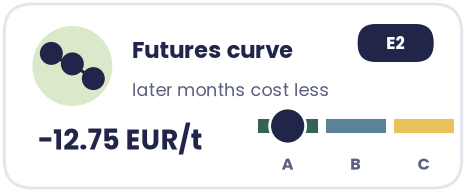
| E2 Futures curve ↑ | December 2026 EUR 230.50, March 2027 EUR 226.75, May 2027 EUR 225.25, September 2027 EUR 217.75 per tonne: later months cost less, 5.5% lower by September 2027. | Euronext, 10 November 2026 | Scenario A |
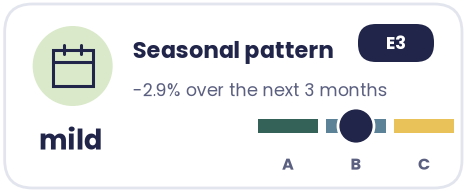
| E3 Seasonal pattern ↑ | Average of the last 10 years (2016 to 2025): EUR 217.02 per tonne at this time of year, EUR 210.62 three months later, 2.9% lower. | Euronext, 10 November 2026 | Scenario B |
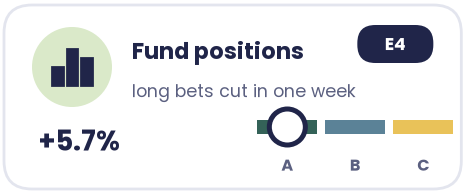
| E4 Fund positions ↑ | Investment funds' net bets on rising prices in Euronext milling wheat fell to +5.7% of open interest on 4 November 2026, from +12.4% a week earlier; still 1.2 standard steps above the 3-year average. In Chicago soft red winter wheat funds hold net bets on falling prices (-13.4% of open interest, 3 November 2026). | Euronext; CFTC, 4 November 2026 | Scenario A (our reading) |
| E5 World stocks ↑ | World ending stocks 2026/27 are 280.8 million tonnes, raised by 4.8 million tonnes in the 1 November 2026 edition; 27.2% of use, higher than in about 9 of 10 years since 1960. | USDA, 1 November 2026 | Scenario A |
| E6 EU crop ↑ | COCERAL: 126.2 million tonnes of soft wheat in 2026 (-6.8%), 1.0 million tonnes less than in July 2026. USDA: EU wheat 133.0 million tonnes (-8.4%); EU ending stocks 11.7 million tonnes (-38.2%), lower than in about 9 of 10 years since 1999. | COCERAL, 1 September 2026; USDA, 1 November 2026 | Scenario C |
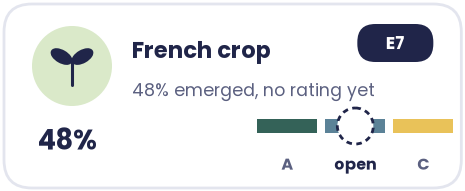
| E7 French crop condition ↑ | 48% of the French winter wheat area had emerged on 2 November 2026, against 55.7% a year earlier. No condition rating has been published yet. | FranceAgriMer, 2 November 2026 | open |
| E8 Weather ↑ | Due to technical problems, this data was not available at the time of writing. | - | open |
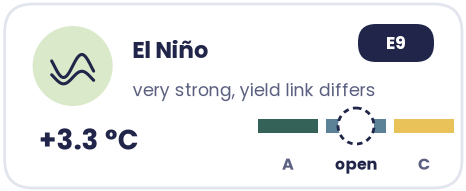
| E9 El Niño ↑ | Very strong; 100% probability for every 3-month period from 1 October 2026 to 31 May 2027; Niño 3.4 +3.3 °C on 14 October 2026. In past El Niño years Australia's wheat yield was a median 7.5% below normal; for France the two yield studies disagree on the direction. | IRI, 19 October 2026; Terensis analysis of USDA and FAOSTAT yields, 6 November 2026 | open |
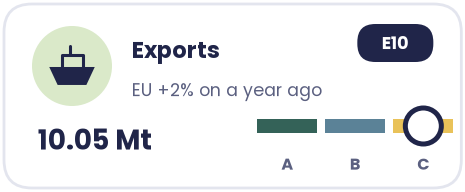
| E10 Exports ↑ | EU soft wheat exports reached 10.05 million tonnes by 8 November 2026, 2% above a year earlier (the Commission says its figures for France are incomplete). USDA cut its forecast of Russian exports by 1.0 million tonnes to 39.0 million tonnes (-18.8% on 2025/26), while Russian export prices fell, as reported on 10 November 2026, ahead of the Abu Dhabi talks. | European Commission, via Commodity3, 11 November 2026; USDA, 1 November 2026 | Scenario C (our reading) |
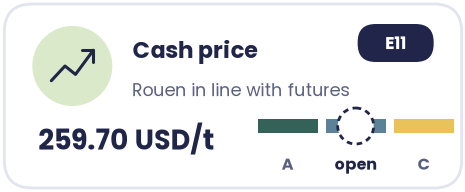
| E11 Cash price ↑ | Grade 1 milling wheat FOB Rouen USD 259.70 per tonne on 4 November 2026, 0.7% lower in a week; the futures price of EUR 230.50 equals USD 258.5 at 1.1214 US dollars per euro. | European Commission, 4 November 2026; ECB, 10 November 2026 | open |
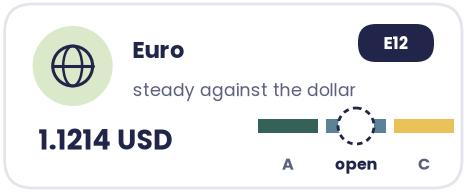
| E12 Euro ↑ | 1.1214 US dollars per euro on 10 November 2026: 0.3% lower in a week, 0.1% lower in a month, 3.2% higher in a year. | ECB, 10 November 2026 | open |
Source: publishers as named in each row, readings dated 2 November 2026 to 11 November 2026. A = scenario A (prices fall), B = scenario B (prices hold), C = scenario C (prices rise). 'Our reading' marks a judgement; all other readings are measured. 'open' = no clear direction.
| Cost model of an example miller | Share of selling price | How it is priced |
|---|---|---|
| Milling wheat | 70% | Euronext milling wheat futures in euros. Base: three equal monthly purchases, average EUR 235.58 per tonne. Each scenario: the same three purchases at the scenario price. |
| Energy, freight and fuel, labour, packaging and margin | 30% | Held unchanged. |
Source: Terensis cost model, 11 November 2026. The shares are an example.
See the margin impact on your products
Same scenarios, your own cost model.
What are you preparing for?
Notes. Metric units; Euronext quotes milling wheat in euros per tonne. One standard price move = the realised price swing of the last 20 trading days, 21.2% a year (Euronext, 13 October 2026 to 10 November 2026), scaled to 3 months: 21.2% x the square root of 3/12 = 10.6%; scenarios A and C are one move below and above scenario B. Only the wheat price moves; energy, freight and fuel, labour, packaging and margin are held unchanged. The scenario price is the first dated contract after the cut-off date, December 2026. Terensis Virtual Agronomist describes market conditions and example cost structures; it is not investment advice. Sources: Euronext (milling wheat futures, curve and Commitments of Traders, 10 November 2026); CFTC (Commitments of Traders, Chicago wheat, 3 November 2026); USDA Foreign Agricultural Service (world, EU and Russia wheat balance, 1 November 2026); COCERAL (EU-27 soft wheat crop forecast, 1 September 2026); FranceAgriMer (French winter wheat progress, 2 November 2026); European Commission (EU soft wheat exports and FOB Rouen price, 4 and 8 November 2026); Commodity3 (EU export data and Russian export prices, 10 and 11 November 2026); IRI, Columbia University (ENSO Quick Look, 19 October 2026); NOAA Climate Prediction Center (ENSO discussion, 15 October 2026); FAOSTAT (wheat yields 1961 to 2024, Terensis analysis, 6 November 2026); ECB (euro reference rate against the US dollar, 10 November 2026); Barchart (wheat market reports, 6 November 2026). Photo: B S, Unsplash; Immo Wegmann, Unsplash.
DISCLAIMER
The information contained in this report is based on data obtained from proprietary, commercial, government and statistical organizations, which Terensis believes to be reliable. While Terensis strives for accuracy, all forecasts, analyses, and assessments or other information in this report are provided "as is" without any warranty of completeness, correctness, applicability or fitness for any specific purpose. In particular, the recipient of this report acknowledges that agricultural, weather, environmental, social and other relevant conditions are inherently uncertain and subject to variables beyond the control of Terensis. Therefore, the recipient assumes full responsibility for any decisions made based on this report. To the fullest extent permitted by law, Terensis excludes all liability for any damages arising in connection with this report. No investment advice.