

Will sugar cost an example EU buyer less, the same or more over the next 12 months?
Prices as of the close on 13 November 2026. The scenarios move the sugar price by one standard 12-month move: 28.6% on ICE raw sugar.
Short answer
Scenario A (lower price) is the most realistic: 5 of 12 signals point to it, 4 to scenario B (same level) and 3 to scenario C (higher price). This is the share of signals, not a statistical chance.
ICE raw sugar settled at 18.41 US cents per pound on 13 November 2026, 12.9% below a month earlier. A weak Brazilian real (5.66 per US dollar, the weakest in 52 weeks), cheaper crude oil and more Indian sugar weigh on the price. A short EU crop (production 22.2% lower) and nearby prices above later prices argue for a higher one.
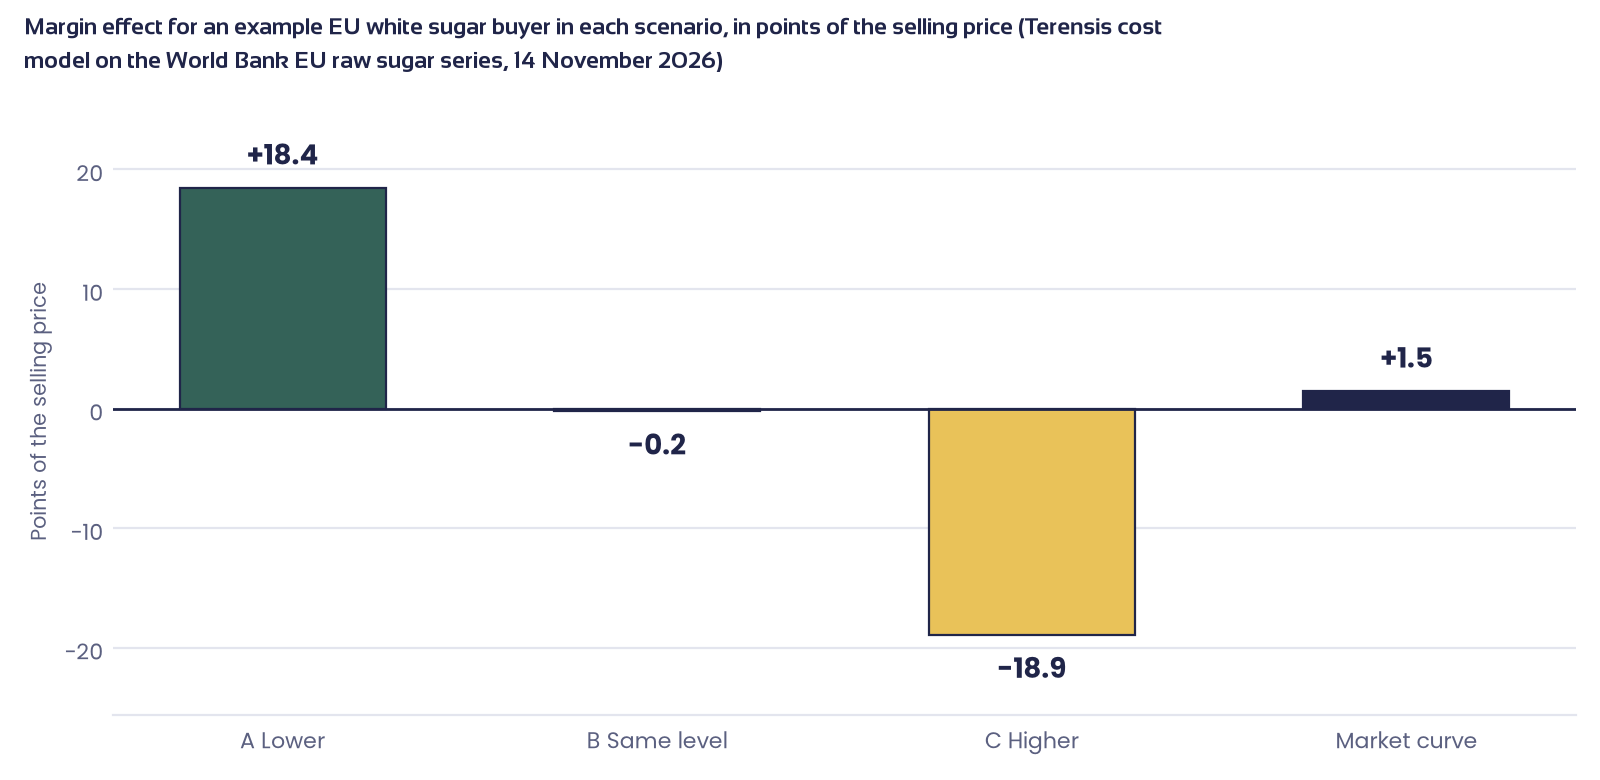
For an example EU white sugar buyer with 65% of the selling price in sugar, scenario A adds 18.5 points of margin, scenario B changes it by -0.2 points and scenario C costs 18.9 points. Our reading: keep part of the next 12 months of sugar unfixed (part 4).
Three scenarios for the sugar price over the next 12 months
Margin effect for an example EU white sugar buyer with 12 months of cover and an unchanged selling price. Sources: World Bank (EU raw sugar, 1 October 2026), ICE Futures US (13 November 2026), Terensis cost model of 14 November 2026. A market curve check adds +1.5 points.
Read the full Margin Call
Leave your email address to read the scenarios in detail, the evidence behind every signal and the cost model, and to download the PDF.
We use your email address to give you access and to follow up on this Margin Call. You can object at any time. More in our privacy policy.
1. Which scenario is most realistic?
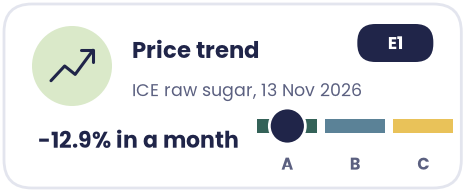
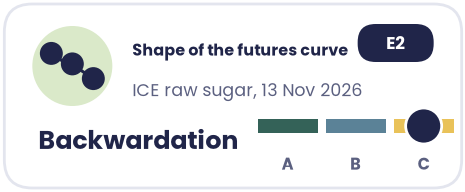
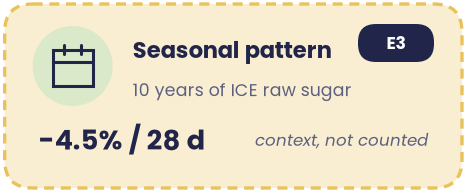
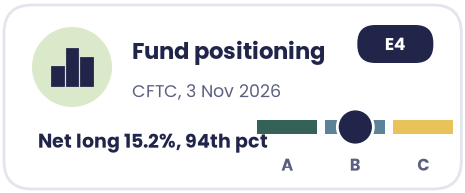
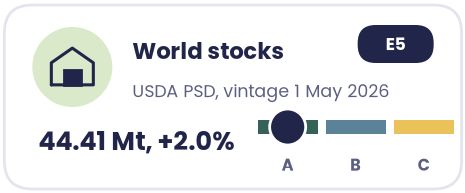
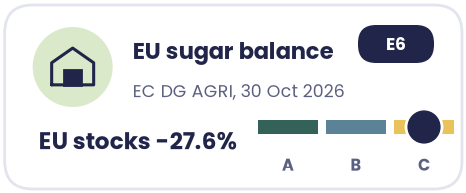
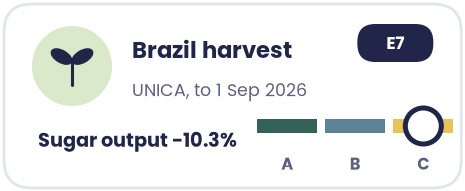
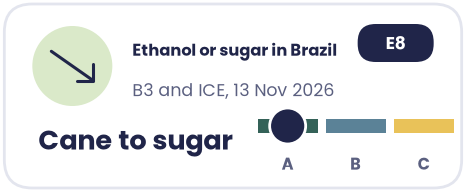
Of 12 signals with a current reading, 5 point to scenario A (lower price), 4 to scenario B (same level) and 3 to scenario C (higher price). Each signal links to its evidence row in part 5. The seasonal pattern describes other years and is context, not counted. Dots with a ring are our reading; filled dots are the direction the data itself gives.


ICE Futures US, CFTC, UNICA, European Commission, USDA, ECB, World Bank, 13 November 2026
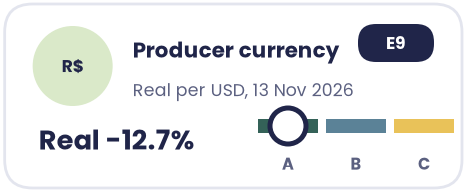
What carries scenario A. ICE raw sugar is down from 21.29 US cents per pound on 14 October 2026 to 18.41. Brazil's real lost 12.7% in a month, and Barchart ties the falls of 26 October 2026, 10 November 2026 and 12 November 2026 to it. Brent crude is 9.5% lower than a month earlier. India's October 2026 sugar output was 845,000 t against 100,000 t a year earlier, and the Indian government ordered state fuel retailers to stop buying ethanol made from sugar from 1 November 2026. The USDA world balance shows ending stocks 2.0% higher (edition of 1 May 2026).
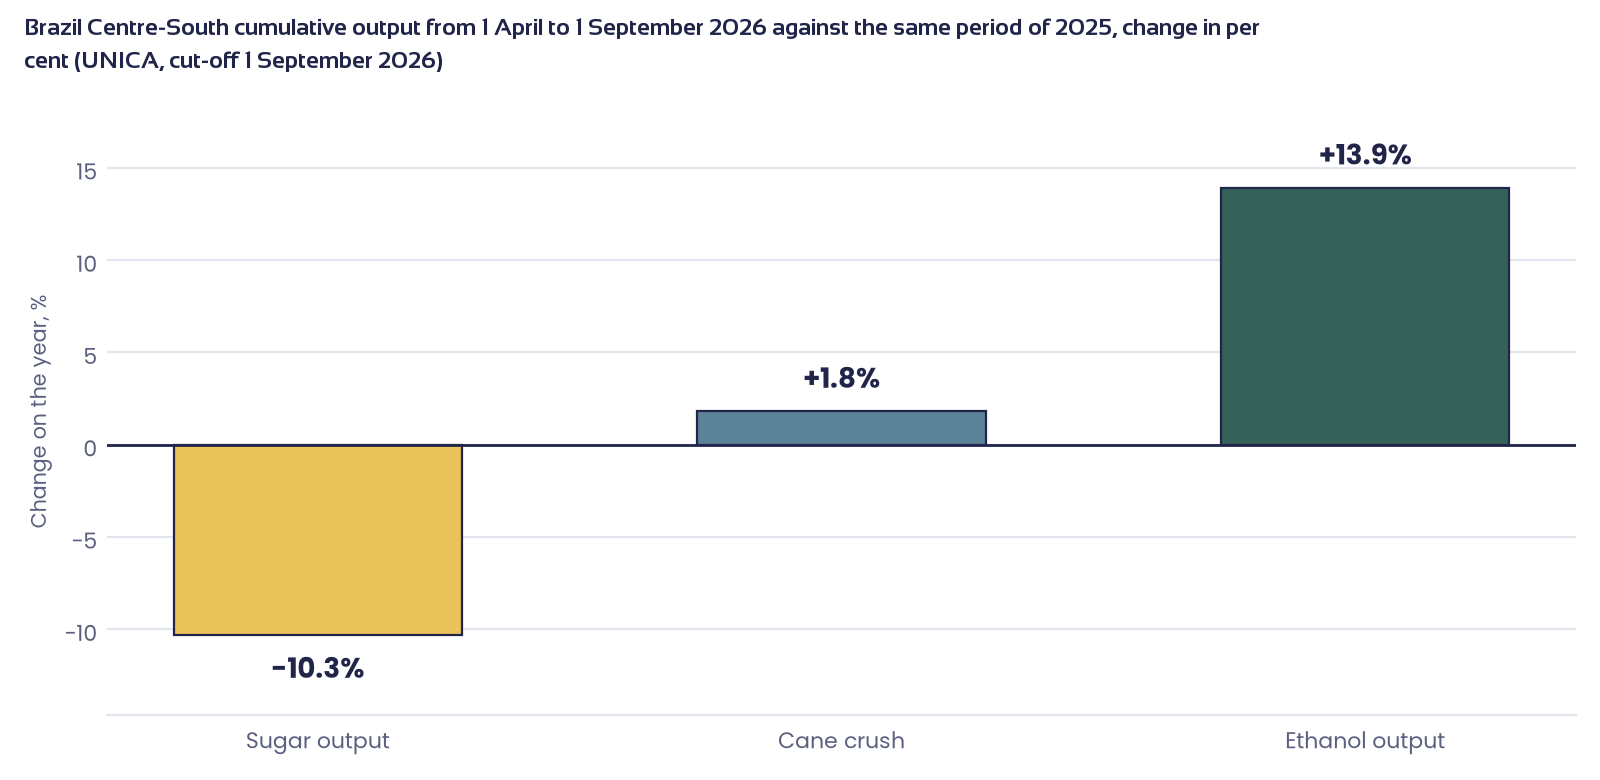
What speaks against it. The EU crop is 22.2% smaller and EU ending stocks are 27.6% lower (European Commission, 30 October 2026). Brazil Centre-South sugar output from 1 April 2026 to 1 September 2026 is 10.3% below the year before as mills made more ethanol. Prices for later months are below nearby months, which the market reads as tight nearby supply.
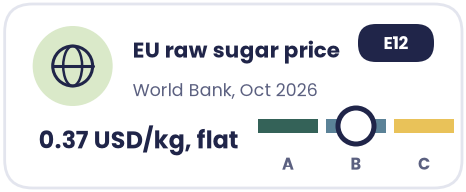
What the headline hides. The 12.9% fall in a month sits on a price that is still 27.5% above a year ago (ICE Futures US, 13 November 2026). The EU raw sugar price that the cost model values has stayed between 0.37 and 0.39 US dollars per kilogram for 12 months (World Bank, 1 October 2026), so it has followed neither the rise nor the fall. The world stock figure is from an older edition than the October 2026 news.
Compound risk. Investment funds hold net bets on rising prices equal to 15.2% of open interest (94th percentile of three years, CFTC, 3 November 2026) while the price is below its 20-day and 50-day averages: a break below 17.92 US cents per pound (the low of 10 November 2026) could be fast. Producers and merchants are net short 24.9% (5th percentile).
| Other market participants | Their view | Compared with scenario A |
|---|---|---|
| ISO, the international sugar body, 13 November 2026 | Forecasts 2026/27 world sugar production 1% lower at 180.1 Mt; Barchart reads this as support for prices. | Differs: points to scenario C |
| Green Pool Commodity Specialists, 21 October 2026 | Raised its 2026/27 global deficit to 6.28 Mt, 3 Mt more than before; it blames poor output in Brazil, India and the EU. The view pre-dates the fall of 26 October 2026. | Differs: points to scenario C |
| Barchart analysis, 5 November 2026 | Sees a selling opportunity in March 2027 sugar futures on more weakness. | Agrees with scenario A |
Barchart (13 November 2026, 5 November 2026) and Commodity3 (21 October 2026) headlines; context, not counted.
2. How do the other scenarios answer it?
- Scenario B (same level), 4 of 12 signals. Fund positioning, realised weather, analogue seasons and the flat EU raw sugar price all point to no change. The price holds near 18.41 US cents per pound if the real stops falling and Indian supply is matched by the short EU and Brazilian sugar crops. It is confirmed if ICE raw sugar stays between 17.92 and 20.95 US cents per pound (the 20-day range to 13 November 2026).
- Scenario C (higher price), 3 of 12 signals. The EU balance (stocks 27.6% lower), the Brazil Centre-South harvest (sugar output 10.3% lower) and the curve with nearby prices above later months point up. It needs the real to recover or the Brazilian sugar share to stay below 52.77% (the same period of 2025, to 1 September 2025), and the next USDA world balance to cut stocks below 44.41 Mt. It is confirmed if ICE raw sugar settles near 23.68 US cents per pound, above the 52-week high of 21.29 set on 14 October 2026.
- What would break the tie. Scenario A leads scenario B by one signal. The USDA sugar report on 17 November 2026 revises the world balance and is the nearest release; a cut of world stocks adds a signal to scenario C.
3. What do the scenarios mean for margin?
How the margin is calculated
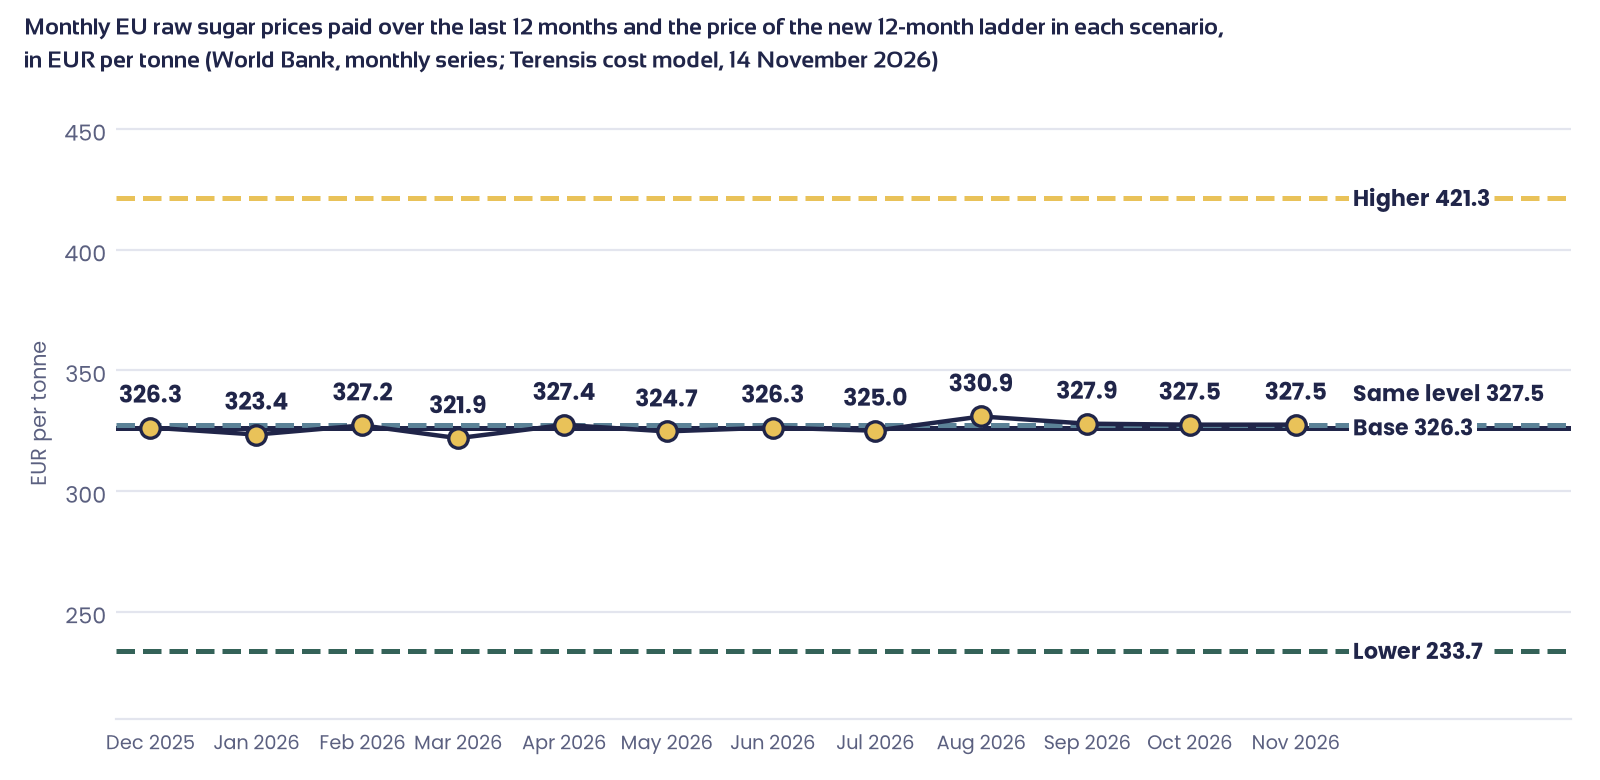
Base: the sugar cost that is already in the selling price today. It is the average price of equal monthly purchases from 13 December 2025 to 13 November 2026. How to read the numbers: "-2.0" means that of every EUR 100 of sales, EUR 2 less stays as margin. "+1.0" means EUR 1 more stays. The selling price is assumed unchanged.
An example buyer of white sugar is used and is illustrative: sugar is 65% of the selling price and other costs and margin 35%. Only sugar moves; every other cost stays at today's level.
| Scenario | Sugar price paid on the new purchases (EUR per tonne) | Change against the base | Margin effect (points) |
|---|---|---|---|
| Base (average of 12 monthly purchases) | 326.30 | - | - |
| A Lower | 233.70 | -28.4% | +18.5 |
| B Same level | 327.50 | +0.4% | -0.2 |
| C Higher | 421.30 | +29.1% | -18.9 |
| Market curve (check) | 319.00 | -2.3% | +1.5 |
Terensis cost model for an example EU white sugar buyer (illustrative shares), World Bank EU raw sugar series (1 October 2026), ICE Futures US (13 November 2026), run on 14 November 2026.
Sizing. One standard move is the realised 20-day volatility of ICE raw sugar (28.64% a year, from the daily settlements between 16 October 2026 and 13 November 2026) times the square root of 12 divided by 12, so 28.64%. Lower is the EU raw sugar price less one move, higher is the price plus one move, same level is the latest price of 0.37 US dollars per kilogram (EUR 327.50 per tonne). The move is sized on the March 2027 ICE contract because the EU series is monthly. The market curve check prices the 12 purchases on the ICE curve of 13 November 2026 and differs from same level by more than 0.5 points, so it is shown. Conversion: 1 tonne = 2,204.62 lb, so 18.41 US cents per pound is USD 405.87 per tonne.
4. What should I do now?
Our reading: the evidence favours scenario A, but each scenario is a 28.6% move either way and the next USDA release on 17 November 2026 can change the count within days.
Price levels that change the call
Open questions the market has not answered yet
- Does the USDA cut world stocks? The world balance still shows ending stocks of 44.41 Mt (edition of 1 May 2026). The USDA sugar report of 17 November 2026 can change that.
- What sugar share do Brazilian mills run now? The latest UNICA data end on 1 September 2026 (46.56% against 52.77% a year earlier); the next report is expected by 27 November 2026.
- Does the Indian cane crop hold? Output in October 2026 was early and large, but a headline of 4 November 2026 reports the lowest monsoon rain in more than a decade, while measured cane-area rain is at the 37th percentile.
| Date | Release | Signals it can change | What would change the call |
|---|---|---|---|
| 17 November 2026 | USDA, sugar: World Markets and Trade | E5 World stocks | World ending stocks cut below 44.41 Mt would move E5 to scenario C; a rise keeps it on scenario A. |
| 18 November 2026 | EIA weekly petroleum report (projected date) | E8 Ethanol or sugar | Falling petrol stocks and a higher crude price lift ethanol against sugar (parity -173.37 USD per tonne now) and move E8 towards scenario C; the reverse keeps scenario A. |
| 25 November 2026 | US personal income and outlays (PCE) | E9 Currency | Past prints above 0.278% month on month saw ICE raw sugar move -0.09% on average, below 0.16% +0.56%; no reliable effect, so it changes the call only through the real. |
| 2 December 2026 | World Bank Pink Sheet | E12 EU raw sugar price | An EU raw sugar price for November 2026 above 0.37 US dollars per kilogram moves E12 to scenario C, below it to scenario A. |
USDA, EIA, BEA and World Bank release calendars, read on 14 November 2026; past reactions from ICE Futures US data since 2010.
5. Evidence
| Evidence | What it says | Source and date | Points to |
|---|---|---|---|
| E1 Price trend ↑ | ICE raw sugar (March 2027 contract) settled at 18.41 US cents per pound, 12.9% below a month earlier and 27.5% above a year earlier. It is under its 20-day average (19.12) and 50-day average (19.00) and above its 100-day (17.40) and 200-day (15.89) averages. The one-month fall gives the direction. | ICE Futures US, settled 13 November 2026 | A Lower |
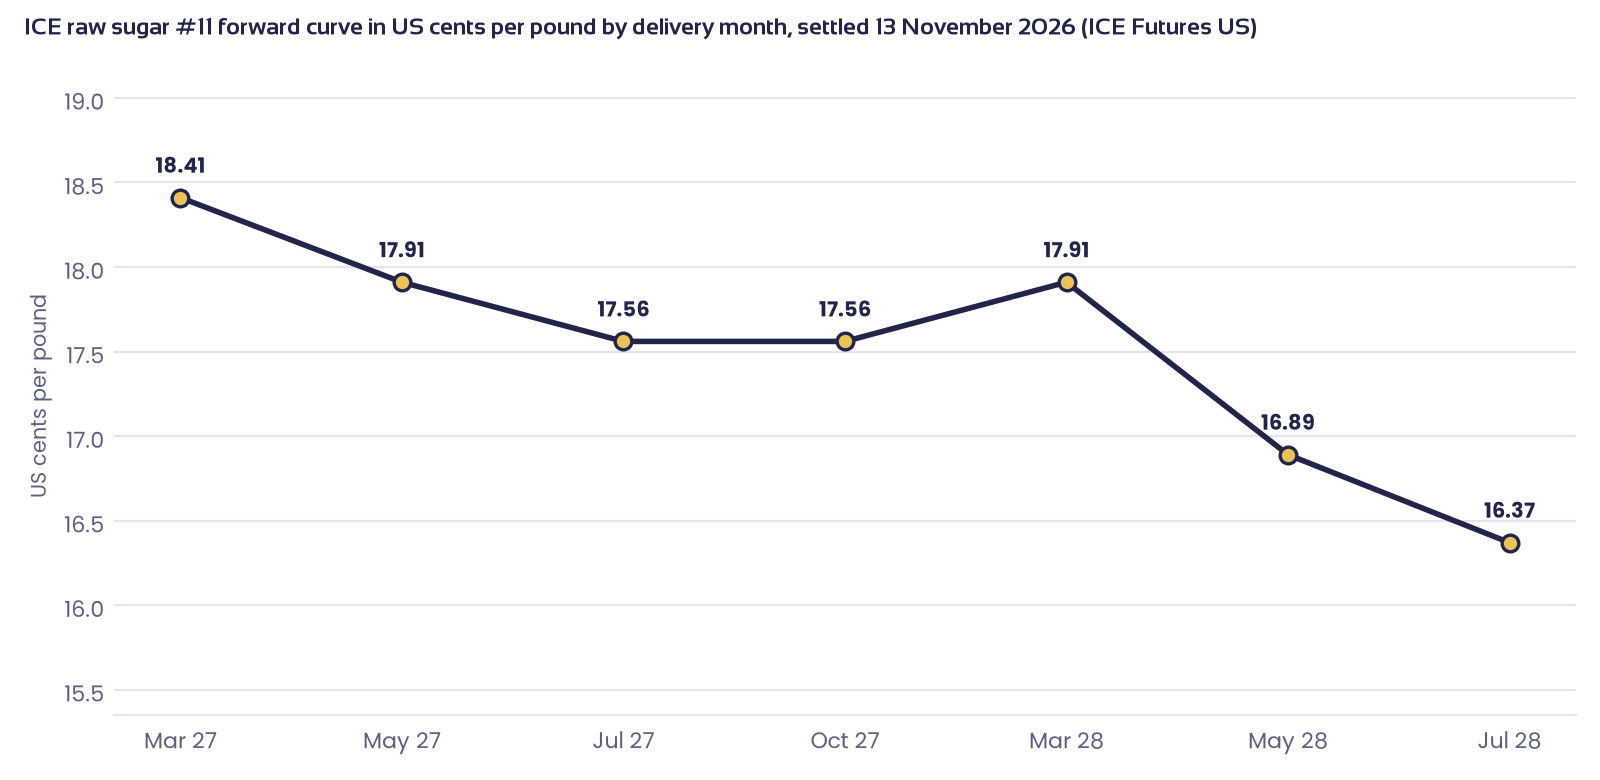
| E2 Shape of the futures curve ↑ | Prices for later months are below nearby months: 18.41 for March 2027 down to 16.37 for July 2028 (US cents per pound). White sugar is in the same shape (514.40 USD per tonne for December 2026, 506.80 for March 2028). The market reads this as tight nearby supply. | ICE Futures US; ICE Futures Europe, 13 November 2026 | C Higher |
| E3 Seasonal pattern ↑ | In the last 10 years ICE raw sugar fell 4.5% over the next 28 days and 3.4% over 61 days from this point of the year, and rose 0.3% over 91 days. It describes other years, so it is context. | ICE Futures US, 13 November 2026 | Context, not counted |
| E4 Fund positioning ↑ | Investment funds hold net bets on rising prices equal to 15.2% of open interest, the 94th percentile of three years (crowded), 0.9 points lower on the week. The weekly change counts as flat. Producers and merchants are net short 24.9% (5th percentile). | CFTC, data of 3 November 2026 | B Same level |
| E5 World stocks ↑ | World ending stocks are 44.41 Mt against 43.52 Mt the year before (+2.0%); world output is 0.6% lower. The figures are the USDA edition of 1 May 2026, the latest stored; the next edition is due on 17 November 2026. | USDA, edition of 1 May 2026 | A Lower |
| E6 EU sugar balance ↑ | EU 2026/27 (1 October 2026 to 30 September 2027): production 12.90 Mt against 16.58 Mt (-22.2%); ending stocks 2.215 Mt against 3.060 Mt (-27.6%); imports 2.60 Mt against 1.76 Mt. | European Commission, DG AGRI, balance sheet of 30 October 2026 | C Higher |
| E7 Brazil Centre-South harvest ↑ | Our reading: from 1 April 2026 to 1 September 2026 cane crush is 1.8% higher at 412.4 Mt but sugar output is 10.3% lower at 24.08 Mt, because the sugar share of cane is 46.56% against 52.77% and ethanol output is 13.9% higher. August 2026 sugar output was 5.6% lower. Less Brazilian sugar supports the price; the next report confirms or not. The latest data are 74 days old. | UNICA, cut-off 1 September 2026 | C Higher |
| E8 Ethanol or sugar in Brazil ↑ | Per tonne of sugar given up, ethanol earns 173.37 USD less than white sugar (53rd percentile of its history, 14.7 lower on the week); against raw sugar the difference is -64.84 USD. The calculation uses provisional conversion factors and the price bases are not declared. Ethanol costs 65.6% of petrol at the pump, which supports ethanol demand. The direction given is that cane moves to sugar. | ICE Futures Europe, B3, ANP, 13 and 14 November 2026 | A Lower |
| E9 Producer currency ↑ | Our reading: the real stands at 5.66 per US dollar, 12.7% weaker in a month and the weakest in 52 weeks. A weak real makes selling sugar more attractive for Brazilian mills, and Barchart ties falls in sugar to it on 26 October 2026, 10 November 2026 and 12 November 2026. The euro is 5.1% stronger on the year at 1.1052 US dollars, which lowers the euro cost of dollar-priced sugar. | European Central Bank, 13 November 2026; Barchart, 12 November 2026 | A Lower |
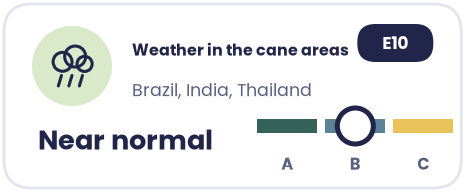
| E10 Weather in the cane areas ↑ | Our reading: cane-area rain since 19 December 2025 is at the 57th percentile of 30 years in Brazil, the 37th in India and the 43rd in Thailand; temperatures are near normal, except India's minimum temperature at the 97th percentile. No yield-sensitive window is open. Near normal weather gives no yield shock either way, so it points to no change. | ECMWF AgERA5 and IFS data, 13 November 2026 | B Same level |
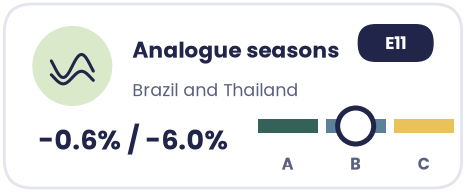
| E11 Analogue seasons ↑ | Our reading: the three closest past seasons for Brazil (2012, 2006, 2010) ran at -3.9%, +0.04% and +2.0% of trend yield; for Thailand (2005, 2013, 2015) at -25.6%, +9.4% and -1.9%. India has too few days of season to match. Overall close to trend; the Thai average is pulled down by 2005. | ECMWF AgERA5 weather and national yield statistics, 13 November 2026 | B Same level |
| E12 EU raw sugar price ↑ | Our reading: the EU raw sugar price is 0.37 US dollars per kilogram for October 2026 (43rd percentile of 66.8 years, EUR 327.50 per tonne) and has stayed between 0.37 and 0.39 for 12 months, while ICE raw sugar rose 27.5%. It points to an unchanged cost level until the next monthly value. | World Bank, monthly average of October 2026 | B Same level |
| E13 Indian sugar supply ↑ | Our reading: India's sugar output in October 2026 was 845,000 t against 100,000 t a year earlier on early Maharashtra crushing (National Federation of Cooperative Sugar Factories, 3 November 2026), and the government ordered state fuel retailers to stop buying ethanol made from sugar from 1 November 2026 (Barchart, 19 October 2026). More Indian sugar reaches the market; the weak monsoon is the counter-argument. | Barchart, 19 October 2026; Commodity3, 3 November 2026 | A Lower |
Publishers as named in each row; readings of 13 November 2026 unless stated. A signal counts for the scenario its direction gives: a bearish reading for scenario A, neutral for scenario B, bullish for scenario C.
The cost structure is an example buyer of white sugar with illustrative shares (sugar 65%, other costs and margin 35%); it is not the reader's own cost structure. Parameters of the ethanol-to-sugar calculation are conventions that have not been signed off.
See the margin impact on your products
Same scenarios, your own cost model.
What are you preparing for?
Illustrative example buyer; shares are not industry data. The count of signals is a share of signals, not a statistical probability. Exchange prices are in US cents per pound or USD per tonne; 1 tonne = 2,204.62 lb. The ethanol parity uses conventions that have not been signed off. Sources: ICE Futures US (raw sugar #11 settlements, 13 November 2026); ICE Futures Europe (white sugar #5 settlements, 13 November 2026); CFTC (Commitments of Traders, 3 November 2026); European Commission, DG AGRI (EU sugar balance sheet, 30 October 2026); USDA (world sugar balance, edition of 1 May 2026); UNICA (Centre-South harvest report, 1 September 2026); World Bank (EU raw sugar price, 1 October 2026); European Central Bank (euro and real reference rates, 13 November 2026); B3 and ANP (hydrous ethanol futures and pump prices, 14 November 2026); Barchart (sugar market headlines, 13 November 2026); Commodity3 (Indian sugar output and monsoon headlines, 4 November 2026); ECMWF (AgERA5 and IFS weather data, 13 November 2026). Photo: Victoria Priessnitz, Unsplash; Daniel Kraus, Unsplash.
DISCLAIMER
The information contained in this report is based on data obtained from proprietary, commercial, government and statistical organizations, which Terensis believes to be reliable. While Terensis strives for accuracy, all forecasts, analyses, and assessments or other information in this report are provided "as is" without any warranty of completeness, correctness, applicability or fitness for any specific purpose. In particular, the recipient of this report acknowledges that agricultural, weather, environmental, social and other relevant conditions are inherently uncertain and subject to variables beyond the control of Terensis. Therefore, the recipient assumes full responsibility for any decisions made based on this report. To the fullest extent permitted by law, Terensis excludes all liability for any damages arising in connection with this report. No investment advice.